
Credit and equity built from the same forecasts, so they can be read side by side.
The Global Credit Forecast Service applies PMA’s established market forecasts to the credit side of the capital stack. Returns, Default Probability and Expected Loss are produced on a consistent, transparent methodology, market by market and sector by sector — and shown alongside geared and ungeared equity on the same basis.
Coverage
Forecasts are produced for each country market and sector, with regional and global aggregates on the same basis. Every figure is produced in-house from PMA’s own market forecasts, and the assumptions behind each number are set out in full.
Historic time series and forecasts of:
What it delivers
Credit return forecasts
Credit returns for every market and sector, updated twice a year in line with the underlying market forecasts.
Equity returns forecast on an ungeared and geared basis from the same market inputs, so both sides of the capital stack are directly comparable.
Expected returns set against the return each market and sector requires, for geared and ungeared credit and equity together.
Sample output
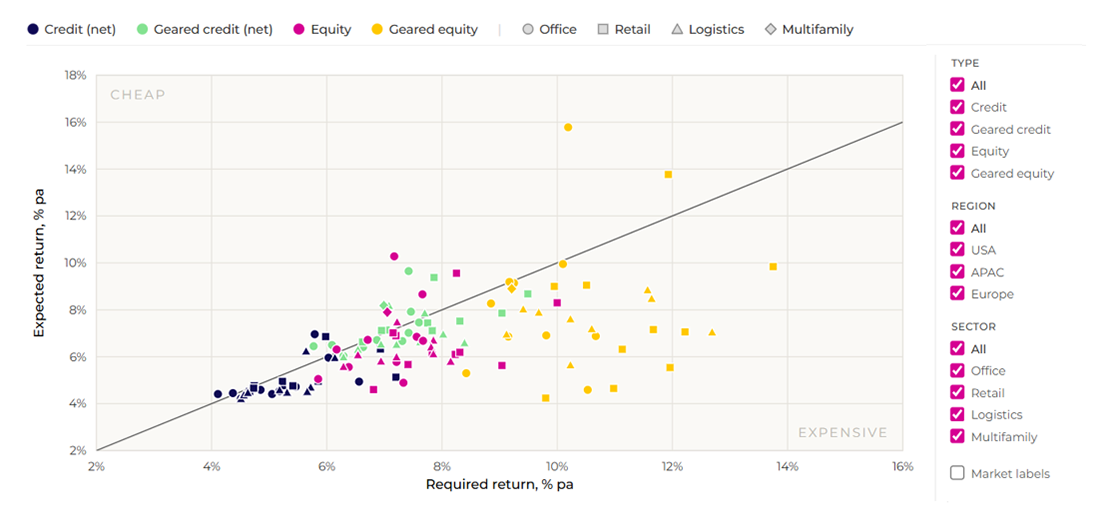
Five-year spot expected returns against required returns, by market and sector. Colour is the asset class, marker shape the sector. Source: PMA Global Credit Forecast Service.
Expected returns are plotted against required returns for four asset classes — ungeared and geared credit, ungeared and geared equity — across markets and sectors. The diagonal marks fair value: the distance from it is the excess return, positive or negative. Filters on type, region and sector isolate any part of the picture, and market labels can be turned on to identify individual points.
Market screening
Our Market Screening Tool applies our methodology to assessing opportunities and understanding loan-level risk, giving originators and risk managers a practical framework for quantifying and comparing risk.
Sample output
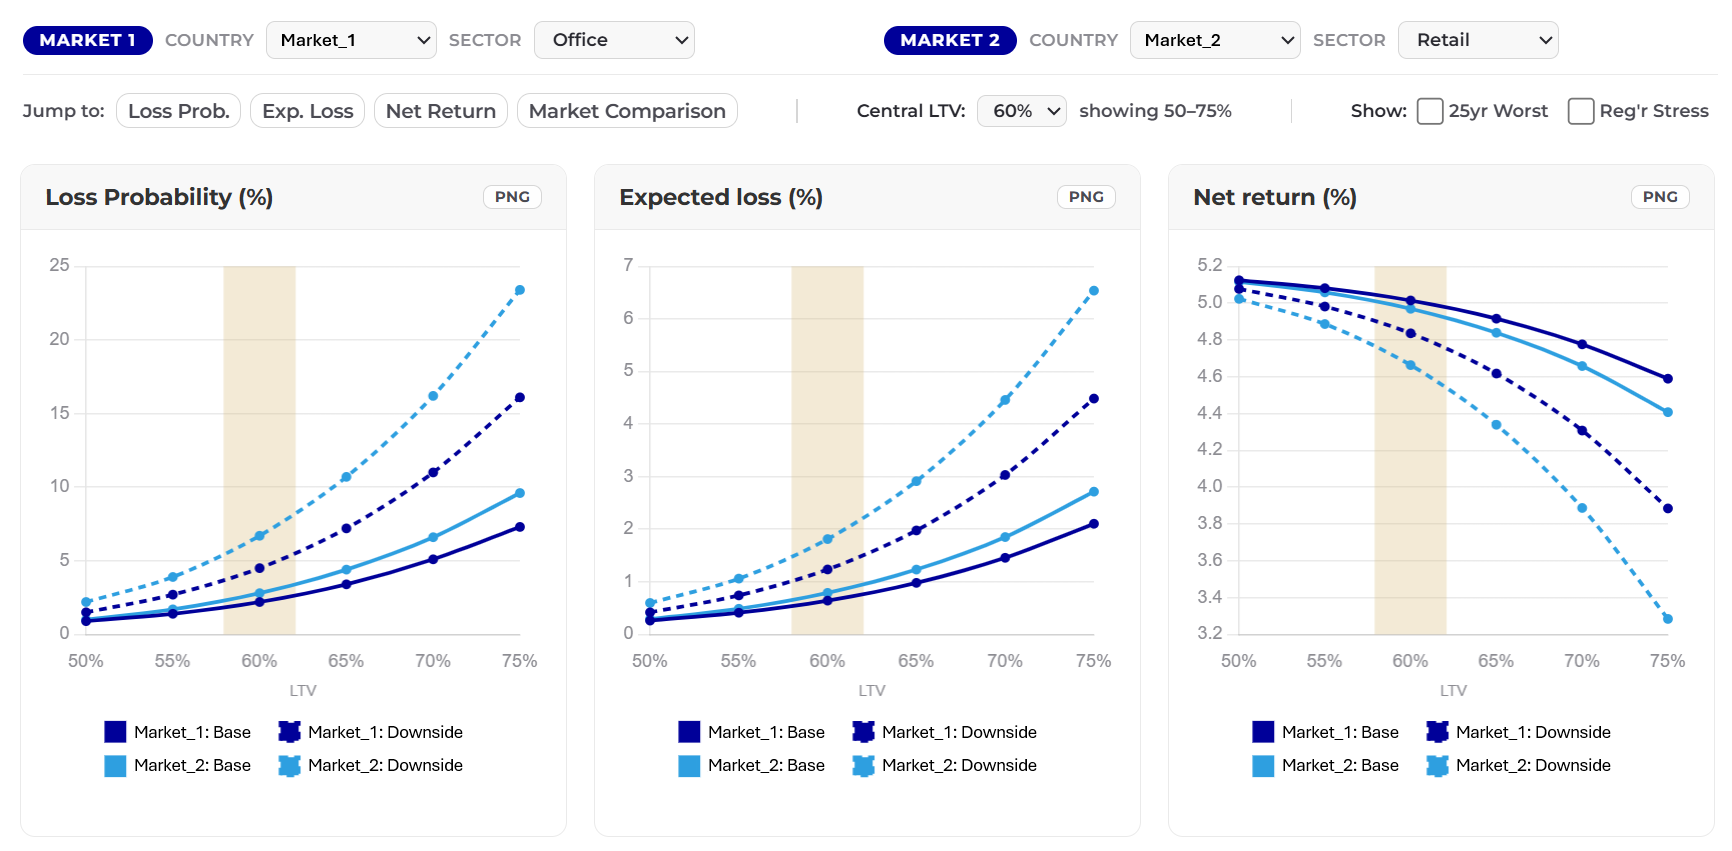
Loss Probability, Expected Loss and Net Return against LTV for two selections, shown around a chosen central LTV. Market names anonymised. Source: PMA Credit Market Screening Tool.
Each side is set independently — country, sector and recovery assumption — and the reference rate, fee and margin are your own inputs rather than ours. The three metrics are returned for both selections at once, with the LTV window set around whichever central LTV you are underwriting to. Four capital value scenarios sit behind the figures: PMA Base, PMA Downside, 25-year Worst and a Regulator Stress Test, the last two switched on as needed. Selections update live and each chart exports to PNG or Excel.
Quarterly publication
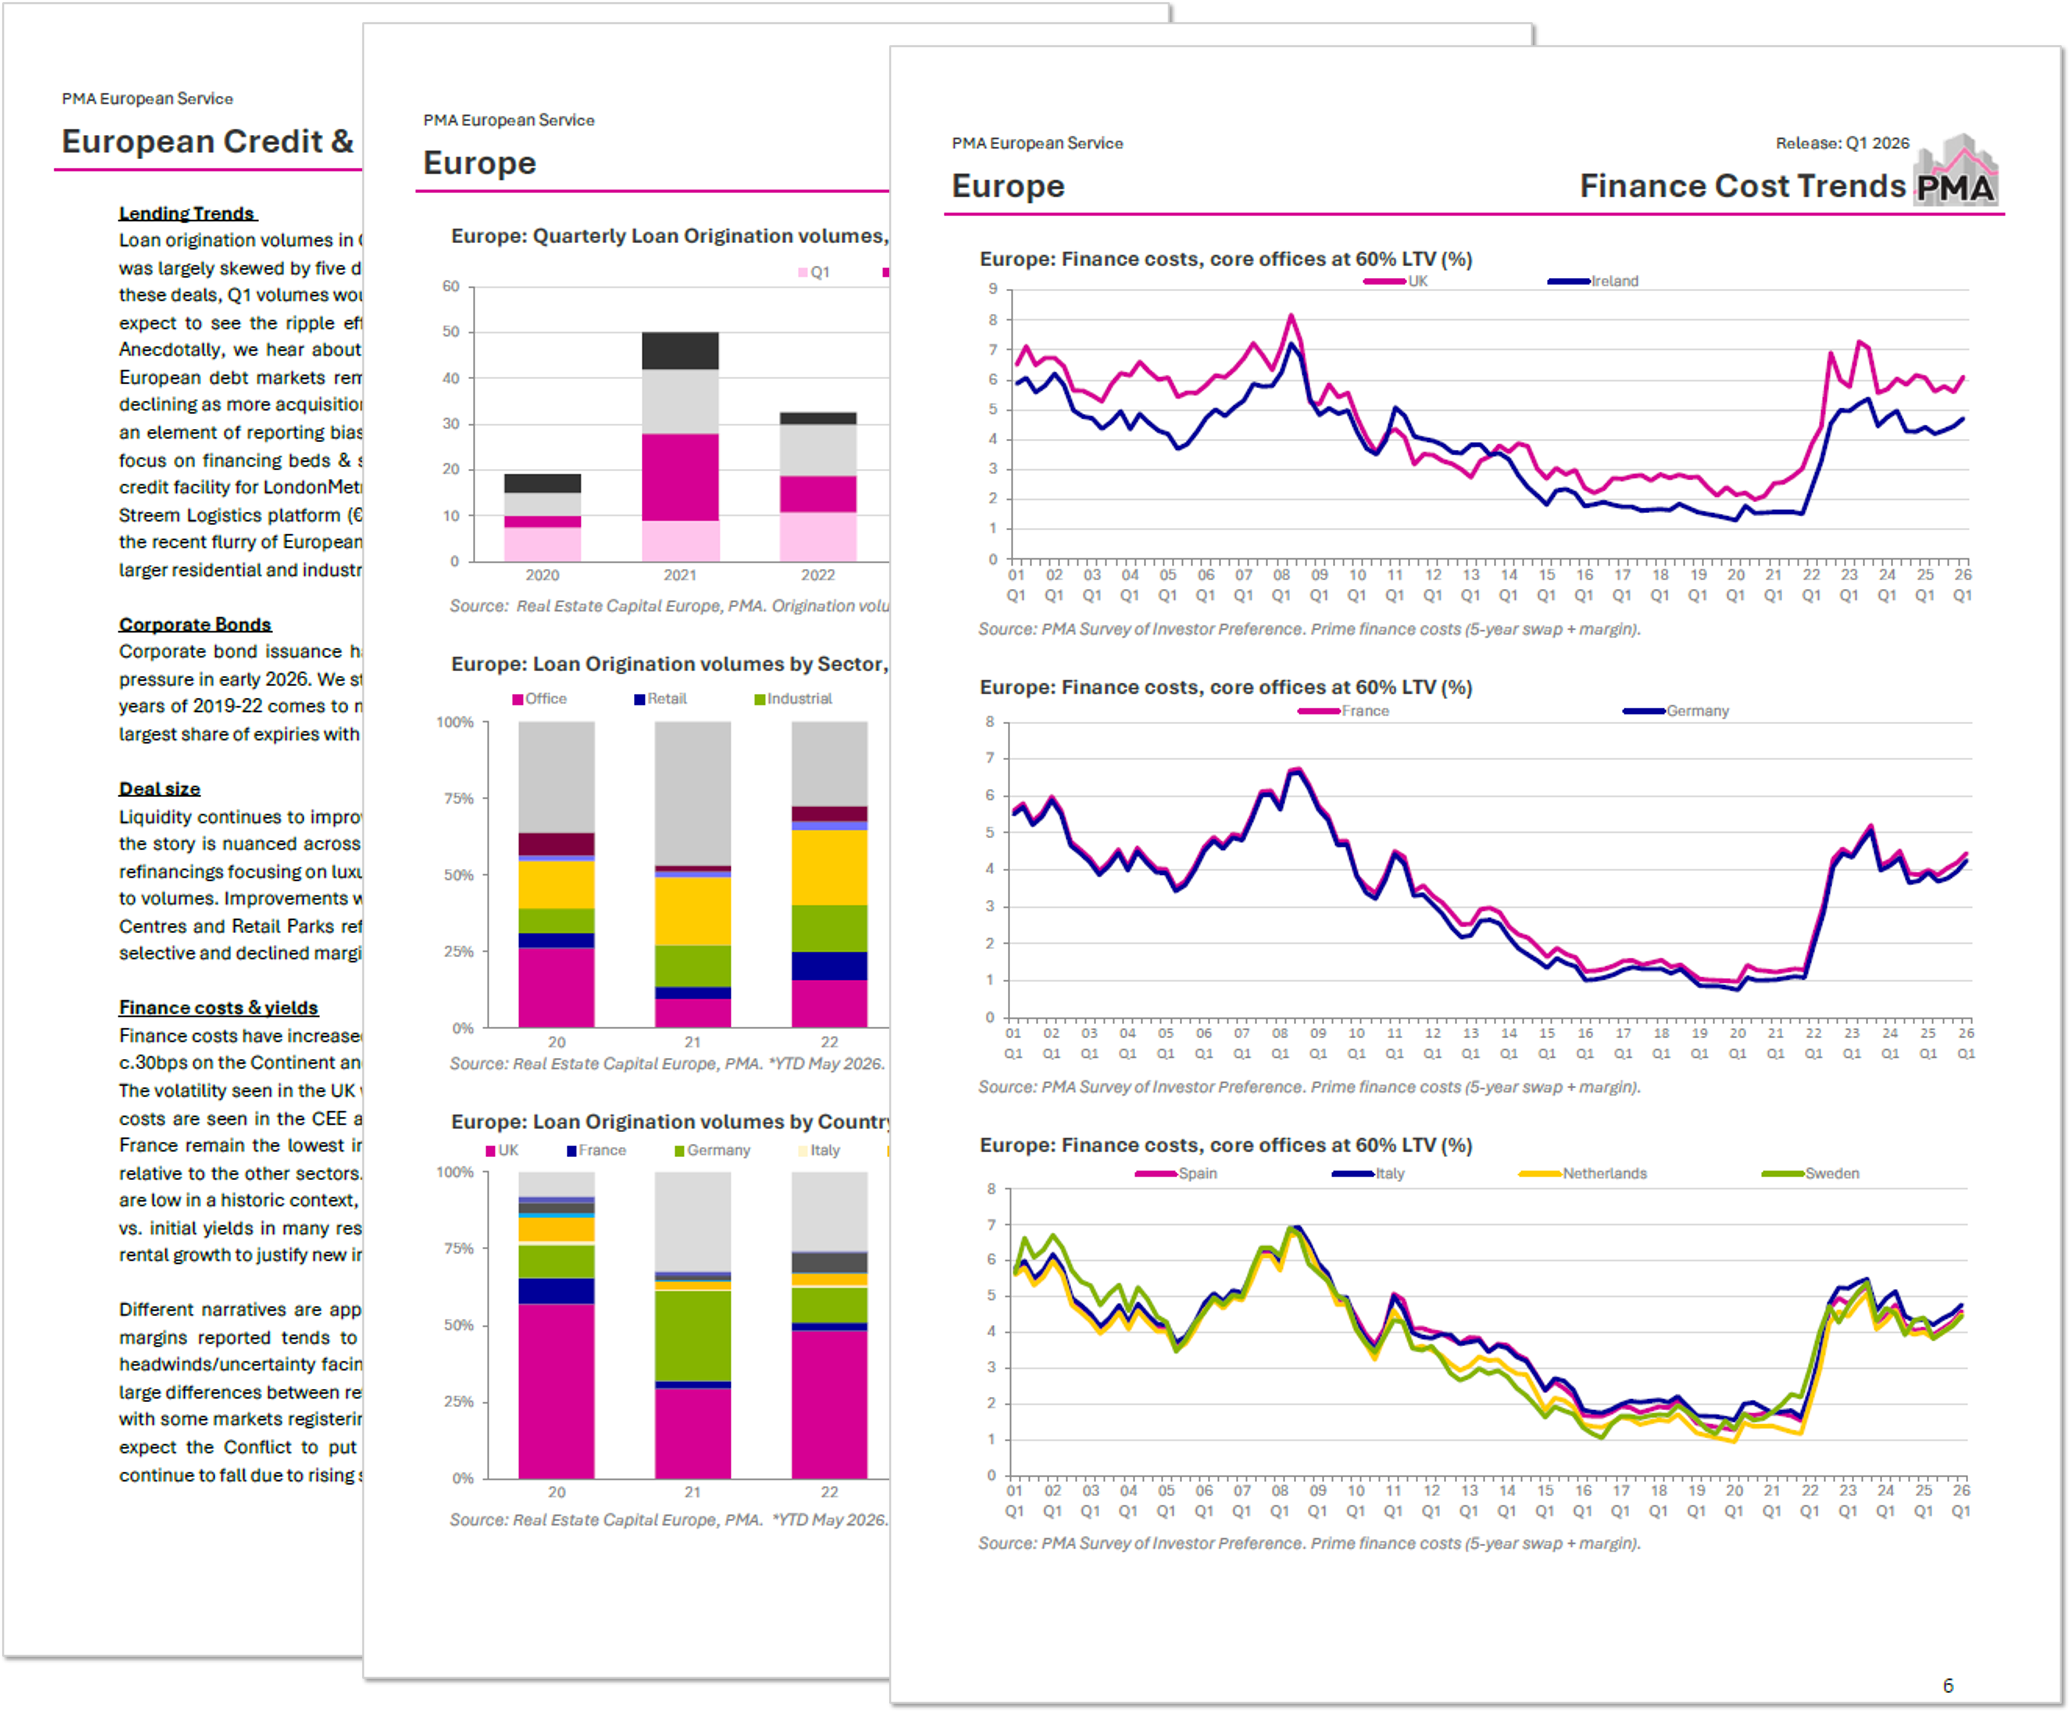
A quarterly publication covering what is actually happening in the lending market, alongside the forecasts.
The benefits
Who it is for
Client support
Regular in-house meetings led by the senior team member responsible for the service, tailored to the sectors, markets or themes you are working on at the time — drawing on local analysts where further depth is needed.
Our on-call enquiry service handles the questions the standard outputs do not answer: a specific market, a specific structure, a specific deal. We are renowned for the speed and detail of our response.